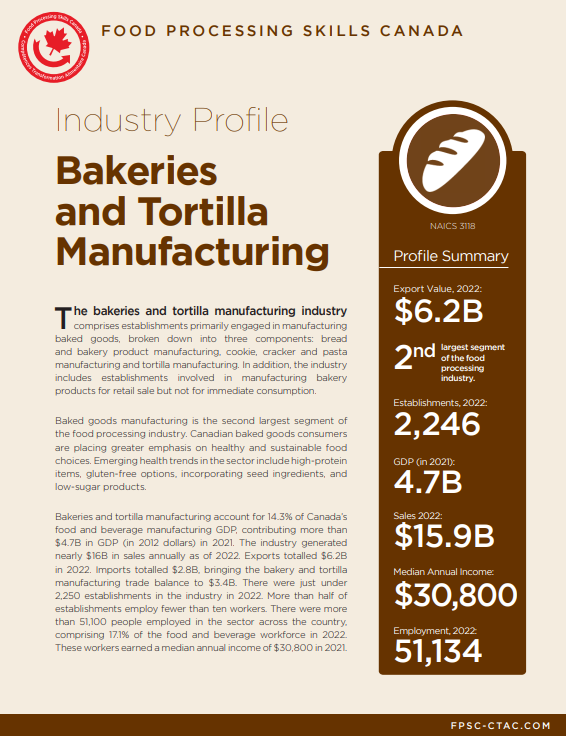
EXECUTIVE SUMMARY

64%

47%
Nearly half of Canada’s bakery processors reported not being able to fill positions or chronic recruitment challenges.
The most prominent HR challenge identified in the sector is a lack of applicants with proper training, viewed as at least somewhat of a challenge by 64% of respondents

Bakery processors reported an increase in recruitment challenges over the past year, with 18% indicating a significant increase.

Fewer than half of bakery processors reported offering benefits at their plant or organization, one of the lowest proportions across the food and beverage processing industry.

Bakery manufacturers cited kitchen positions as most difficult to recruit for, specifically certified bakers (37%).

METHODOLOGY AND RESPONSES
How we did it
100 Bakery processors responded to this survey and participated either online or by telephone between February and May 2020. The extended time in f ield was due to COVID –19 pandemic. It wasn’t possible to ask as many questions in the phone version of the survey as opposed to the online version. As such the number of respondents is indicated by N for every chart and ranges from 22 to 100 depending on the question.
Region | Survey Responses |
BC | 18 |
AB | 19 |
SK/MB | 4 |
ON | 34 |
QC | 17 |
Atlantic Canada | 7 |
Not Specified | 1 |
TOTAL | 100 |
The majority of the questions in this report were asked to food and beverage processors across the country, there were 740 responses in total to the survey. The findings of the overall survey are available on the FPSC website (https://fpsc-ctac.com/reports/) in the report titled: 2020 Labour Market Information Survey Report – Canadian Food & Beverage Manufacturing Industry Report

BAKERY PROCESSORS SURVEY

Overview
- Industry Profile
- Workforce Profile
- Workforce Availability and Recruitment
- Wages and Benefits
- Training and Skills Development
- Impact of Covid-19

OTHER FOOD PROCESSING INDUSTRY PROFILE
In a Snapshot
- 66% of facilities process retail bakery products, 49% process cookies and 45% process frozen bakery products.

- The vast majority of facilities (85%) produce products in Canada, while 11% of facilities produce products both domestically and abroad.

BAKERY PROCESSING INDUSTRY PROFILE

BAKERY PROCESSING WORKFORCE PROFILE
- The “average” processor in Canada has 60 paid positions, including both filled and vacant positions
- 76% of processors reported fewer than 50 paid positions at their facility
- 6% of processors reported 200 or more paid positions are their facility
* Includes both filled and vacant positions
Size of Processing Facilities, Paid Positions*

Employment Size
- The “average” Bakery processor has 60 paid positions at their facility
- On average, nearly threequarters of paid positions are filled by women
- A significantly lower portion are filled by workers with disabilities (3%) or Indigenous Peoples (2%)


Employment by Occupation
- On average, entry level labourers account for the highest number of positions, vacancies and new hires
- Bakers (certified & apprentice) and roles in management, finance & administration are also common positions
Average number of people employed

Average number of current vacancies in total

Average number of people hired in 2019


Highest level of Education Required
- Four-in-ten processors require bakers to have a high school diploma, though half (52%) require certified bakers to have a college or trade school diploma
- Most processors only require a high school diploma for entry level general labourer positions
Most processors require higher education for management, finance & administration and quality control & assurance positions.
High School Diploma | College Diploma / Trade School | University Undergraduate Degree | CAP/Other | Experience/ past training in field | None | Not Applicable | Don’t Know | |
---|---|---|---|---|---|---|---|---|
Total Bakers (n=97) | 40% | 30% | – | 2% | 2% | 14% | 9% | 2% |
Certified Bakers (n=67) | 13% | 52% | 3% | 1% | 1% | 6% | 19% | 3% |
Apprentice Bakers (n=51) | 37% | 20% | – | – | 2% | 18% | 20% | 4% |
Chef/Cooks (n=62) | 16% | 44% | 3% | – | – | 8% | 24% | 5% |
Entry level General Labourers (n=78) | 51% | 1% | 1% | 1% | 1% | 26% | 14% | 4% |
Skilled/Semi-skilled Process Control + Machine Operators (n=56) | 43% | 25% | – | – | 4% | 12% | 12% | 4% |
Retail Salespersons (n=38) | 37% | 8% | 5% | – | – | 21% | 24% | 5% |
Management, Finance + Administration (n=37) | 11% | 24% | 46% | 3% | 3% | – | 5% | 8% |
Quality Control + Assurance (n=72) | 17% | 29% | 26% | – | 6% | 10% | 10% | 3% |
Delivery drivers (n=37) | 43% | 5% | – | – | 3% | 11% | 27% | 11% |
Any other Occupations (n=36) | 50% | 22% | – | – | 8% | 8% | 11% |
Business Outlook
- On average, entry level labourers account for the highest number of positions, vacancies and new hires
- Bakers (certified & apprentice) and roles in management, f inance & administration are also common positions

Business Challenges
- The availability of labour is the most significant business challenge within the industry, as approximately sevenin-ten (69%) Bakery processors identified this as at least somewhat of a challenge
- Regulatory requirements (52%) and implementing new technologies (44%) were also viewed as challenges by a large share of processors

WORKFORCE AVAILABILITY AND RECRUITMENT
Recruitment Challenges
- A further 25% reported experiencing occasional or seasonal challenges
- All together, 76% report some form of challenges recruiting or retaining qualified workers
National Survey of Bakery Processors Nearly half (47%) of Canada’s Bakery processors reported not being able to fill positions or chronic recruitment challenges.
Workforce Availability
22%
Experiencing immediate and persistent challenges throughout the year recruiting and retaining qualified workers and cannot fill vacant positions
25%
Experiencing ongoing challenges recruiting or retaining qualified workers to successfully fill positions
29%
Experiencing occasional or seasonal challenges recruiting orretaining qualified workers. Cannot fill vacancies during peak periods
23%
Experiencing no significant challenges in recruiting or retainingqualified workers
1%
Refusal
- The majority of processors (54%) reported these challenges have remained constant over the past year
- Only 7% reported recruitment challenges decreased over the past year

35% of Bakery processors reported an increase in recruitment challenges over the past year, with 18% indicating a significant increase.
Bakery Roles Most Difficult to Recruit For
- Three-fifths (60%) of bakery manufacturers cite kitchen positions as most difficult to recruit for
- Approximately 40% find production positions most difficult to recruit for
- The most difficult positions to recruit for include certified bakers (37%)

Human Resource
- The bakery and tortilla sector identified several HR challenges impacting the majority of processors
- The most prominent issue, reported as at least somewhat challenging by 64% of processors, was a lack of applicants with proper training. This was followed by lack of qualified applicants (61%), lack of applicants with adequate skills (58%) and applicants with too high wage expectations (56%).


Immigration Programs
13% of Bakery processors reported utilizing the TFWP, while 12% reported utilizing the PNP program.

Underrepresented Groups
- The majority of Bakery processors reported making concerted efforts to recruit youth under 30 (53%) and women (51%)
- Recruitment efforts lagged behind for Indigenous Peoples (27%) and people with disabilities (21%)

WORKFORCE WAGES AND BENEFITS
In a Snapshot
- On average, bakers earn nearly $3 more per hour than entry level frontline workers
- This disparity in wage could be attributed to the higher level of education required for a baker position, specifically for certified bakers


- Fewer than half (45%) of Bakery processors reported offering benefits at their plant or organization, one of the lowest proportions across the food and beverage processing industry.
- Of those who provide benefits, nearly all processors (95%) provide employees with extended health or drug plans, while paid days and sick leave were also frequently reported by 77% of processors
- A smaller proportion of processors reported offering tuition reimbursement (23%), RRSP matching (18%) and pension plans (18%) to employees. A relatively smaller number of processors offer these benefits compared to other sectors within the food and beverage industry
Benefits Offered
97%
Extended health or drug plan
77%
Paid days or sick / family leave
23%
Tuition reimbursement
18%
RRSP matching
18%
Pension plan
14%
Workplace perks
9%
Other
5%
Bonus
TRAINING AND SKILLS DEVELOPMENT
In a Snapshot

- Bakery processors reported an average training budget of $4,455 annually.
- The sector utilizes a variety of training tools, while on-the-job training (92%) and in-house training (89%) are the most common tools used within the sector


Automation in the Bakery Sector
- 22% of Bakery processors reported moderate integration of automated production processes
- 19% of processors reported no integration, slightly higher than the total sample


Educational Programming
- Almost half (46%) of bakery processors rate the educational programming designed to produce graduates for their sector as being adequate or excellent
Question: How would you describe the Educational Programming designed to produce graduates for your sector?


Perceived Threat
- The majority of Bakery processors surveyed (92%) think COVID-19 poses at least some threat to their business, while a significant portion (42%) feel highly threatened by it.
- Only 6% of processors reported they saw no perceived threat to their business

IMPACT OF COVID-19

Production Volumes
- The majority of Bakery processors surveyed (70%) reported a reduction in production due to COVID-19
- Approximately a quarter (24%) reported an increase in production volume due to COVID-19


-
Bakery processors have been impacted in many ways by COVID-19
- Decline in customer orders has been the most notable impact, as reported by 68% of processors
- Decline in cash flow was also reported
-
Bakery processors also took different approaches to dealing with COVID’s impact
- Decline in customer orders has been the most notable impact, as reported by 68% of processors
- Decline in cash flow was also reported

Impact of COVID-19
Decline in number of workers available
45%
Decline in availability of raw materials or supplies
46%
Decline in orders from customers
68%
Closure due to health concerns
22%
Decline in cash flow
48%
Action Taken
Increased outsourcing
6%
Allowed employees to work from home
16%
Reduced workers’ hours
58%
Laid-off workers
56%
