Subscribe to our free newsletter for the latest food industry news and insights

SUMMARY

The dairy processing industry is the third-largest food processing industry in Canada and the largest in Quebec. Canada’s Dairy processing industry is diverse and produces a large number of distinct products grouped under three broad categories: fluid milk and fluid milk products, cheese and cheese products and butter and dry and canned dairy products. Producers of these products includes small, medium and large processors located in both rural communities and large urban centers.

This report provides a summary of findings from the Dairy Processing Labour Market Study conducted for the Food Processing Skills Council (FPSC). The objective of this study is to provide evidence-based assessments of current and future employment, hiring requirements and labour market conditions for Canada’s dairy processing industry at national and regional levels. The information is meant to better inform government, employers and industry stakeholders about the degree and nature of labour market challenges faced by Canada’s Baked goods manufacturing industry.

Between 2021 and 2030, the rate of employment growth for the Canadian dairy processing industry is expected to be approximately 11% growing from approximately 24,900 employees in 2021 to 27,600 by 2030.

As a result, the dairy processing industry will need to find an additional 9,300 new employees by 2030. This total demand will be 36% due to growth, and 64% due to replacements.

Labour market tightness is expected to persist through 2022 as economic recovery collides with reduced rates of labour force participation. This means that recruitment and retention will be particularly challenging for many occupations and roles through 2022.

Increased labour force participation is expected to ease recruitment challenges for several occupation groups by 2023, but then labour market tightness will return in 2028 onwards as labour force growth slows and there is increased competition from other industries.

By 2028, recruitment challenges will be most severe for occupations and roles related to:

Woman in a white lab coat holding a milking machine inside a modern dairy facility, surrounded by milking equipment and industrial machinery.

Who will the dairy processing industry need to find?

On an annual basis, the industry will need to recruit

  • 344 new managers, sales, logistics and admin staff
  • 146 new entry-level labourers
  • 244 skilled/semi-skilled operators and managers
  • 146 trades people

Part 1
SECTOR OVERVIEW AND CURRENT CONTEXT

Smiling worker in a blue uniform and white apron standing beside a crate of large round cheeses in a clean, well-lit dairy processing facility.

1.0 INTRODUCTION

Importance of LMI

Food Processing Skills Canada (FPSC) is pleased to present this report to the dairy processing industry, government decision makers and other industry stakeholders. This summary report focused specifically on the dairy processing industry is one in a series of labour market information (LMI) studies that have been designed to be a resource for all. The report covers details on the structure of the industry, current challenges and opportunities, and an overview of the important role of labour in ensuring the industry’s success now and in the future.

Accurate and timeline labour market information (LMI) has significant benefits for industry, decision-makers and stakeholders such as understanding the composition of the current workforce and determining estimates of future supply and demand to inform workforce planning. This report demonstrates that labour challenges and concerns are currently top of mind for the dairy processing industry. It outlines the evidence and storyline that estimates labour challenges increasing for many key occupations, particularly towards the end of the current decade.

Canadian dairy processors are the link between the farms and tables for a multitude of products. The structure of the industry is such that the vast majority of dairy products consumed by Canadians are produced by Canadian dairy processors, with limited imports Understanding the importance of the industry is relatively easy – understanding the challenges that the industry faces to have continued success and growth is more difficult. Understanding challenges using a solution-focused lens requires in-depth, detailed knowledge of the labour situation overall and by subsector within the industry. This LMI study provides an important step towards this more in-depth understanding.

Focusing specifically on the Canadian dairy processing industry, this study provides evidence-based assessments of current and future employment, hiring requirements and labour market conditions at national and regional levels. In addition, potential solutions and opportunities to address identified challenges are presented within the context of the overall Canadian food and beverage processing sector.

Canadian dairy processors are the link between the farms and tables for a multitude of products.

LMI REPORT SERIES OVERVIEW

This report on the Canadian dairy processing industry is one in a series of LMI reports produced by FPSC. In addition to this national summary report, FPSC has developed 11 brief region-specific reports that focus on LMI within ten areas in Canada with concentrated dairy processing employers. The recent LMI report on the overall Canadian food and beverage processing industry (At the Crossroad to Greatness, 2021) provides an excellent context for the current report. Even though the dairy processing industry is quite distinct as a sub-sector, there are some trends and insights from the overall report that could be equally applied to the dairy processing industry. Finally, there are other sub-sector specific LMI reports available that may be of interest in understanding the comparability of the dairy processing industry with other sub-sectors such as meat processing, fish & seafood processing, baking, and other food industry.

A collection of labour market reports and summaries related to Canada’s food and dairy processing sectors, including a 2021 report titled 'At the Crossroad to Greatness', a national summary report for Canada’s Dairy Sector, and several blue-covered regional profiles such as Belleville, ON.

The 11 regional reports focus on the following geographic locations that have higher concentrations of processors and those employed by the dairy processing industry.

METHODOLOGY

This report was developed using various data sources including both primary and secondary research to develop profiles of the Canadian dairy processing labour market and projections of labour demand and supply over the upcoming decade. Methods were specifically selected to complement one another in providing an understanding of the dairy processing labour market from multiple angles.

Key methods as outlined in the table included a national survey of dairy processors in 2020, extensive analysis of industry and workforce data from Statistics Canada (e.g., Labour Force Survey, Census), review and analysis of other sources of industry data (e.g., OECD, Industry Canada, Agriculture and Agri-Food Canada), scans of training and education programs, and interviews with industry associations and employers.

Method Objective Approach
Review of Statistics Canada Reports and Data Profile the industry, estimate current and potential future contribution to the economy, and project growth in production and employment. In-depth analysis of most current and relevant labour market statistics and population data.
Review of other primary and secondary data sources Complement the review and analysis of Statistics Canada data an to estimate potential labour demand and identify data gaps. Identify key industry trends of most relevance to the labour market. Review and extract key data and information from the most relevant government, private and NGO reports (e.g., OECD, Industry Canada, Agriculture and Agri-Food Canada, Advisory Council for Economic Growth, FPSC)
Survey of Dairy Processors Identify labour market challenges and related issues (e.g., HR challenges, retention and recruitment strategies) 89 dairy processors were surveyed using online and telephone interviewing techniques.
Identification of Study Programs for Dairy Industry Profile the range of programs available and to help identify potential gaps related to employer needs. Scan of approximately [[XXX]] dairy-related programs and courses offered by Canadian post-secondary institutions, private career training organizations, industry associations and secondary vocational training.
Interviews and Consultations with Industry Stakeholders To collect qualitative information, views and perspectives on key labour market challenges and solutions for the dairy processing industry. Consultations and interviews conducted with provincial dairy processing associations, dairy processors, and other industry stakeholders

2.0 SECTOR CONTEXT AND BACKGROUND

Sector Overview and Structure

Dairy manufacturing comprises companies or cooperatives that are primarily engaged in processing raw milk for beverage use, and manufacturing cream and other processed dairy products, such as butter cheese and ice cream. The industry also includes the production of dairy product substitutes (e.g., soy, almond, oat milk, etc. and their derived products). Although dairy processing is closely linked to raw milk production by dairy farmers, the dairy processing industry is defined according to when the raw milk arrives at a processing plant bay for unloading.

Dairy processing plants are generally located close to where farm milk production is concentrated: producers of fluid milk tend to be located on the fringe of urban areas to serve the consumer market, while manufacturers of products with a longer shelf life tend to be concentrated closer to the raw milk supply to keep costs low and a reliable access to their main input.

There is large diversity in the types of establishments observed in the industry, ranging from private companies to multinational conglomerates, dairy cooperatives and small companies with few employees.

Dairy Product Manufacturing (NAICS 3115)

Following the North American Industrial Classification System (NAICS) 2017, the sector includes:

The Canadian Other Food Processing Industry is largely composed of SMEs with fewer than 200 employees (98%)

The Canadian dairy industry is heavily regulated. Regulations include food safety requirements as well as a complex supply management system that establishes production quotas, controls pricing, and sets import tariffs.

Canadian Dairy Commission/Canadian Milk Supply Management Committee

  • Determines the national milk quota on a monthly basis
  • Determines support prices for butter fat and SMP annually

Provincial Marketing Milk Boards

  • Receive a quota based on historical market shares
  • Determine how much can be produced by an individual quota holder
  • Have price-setting authority and collectively negotiated with dairy farmers and use support prices as reference
  • Purchase all milk from dairy farmers and sell directly to processors

Dairy Farmers

  • May purchase or sell individual production quotas at monthly auctions
  • Sell product to provincial milk marketing board at a blended prices (determined within regional pools)

Dairy Processors

  • Purchase inputs from the provincial marketing board
  • Set prices of dairy products for distributors and retailers

Retailers

  • Set the final retail price to consumers
Group of six diverse young adults smiling and posing closely together, suggesting a friendly and inclusive atmosphere.

Different Types of Milk Products

Milk products are generally divided according to fluid milk products and industrial milk products.

Fluid Milk – used for beverages such as milk (3.25%, 2%, 1%, skim), buttermilk, flavoured milk (chocolate and other flavours, and eggnog.

Industrial Milk – about 70% of milk production and is used in a product other than fluid milk. These can include:

Cheese production in Canada exceeds 1,400 different kinds…

Cheeses are classified according to moisture content. Organized by their share of total production, these are:

Voices of the Canadian Dairy Processing Industry

Key stakeholders in the Dairy Processing Industry are the national and regional industry associations. These organizations on behalf of their members consult, lobby and conduct research for the dairy processing industry in Canada:

Industry Research and Development

There are several research and development centers and programs funded by public and private sources, which aim to develop new and differentiated products to keep the dairy processing industry competitive. Several are linked to postsecondary institutions and work in multidisciplinary teams directly with industry.

Smiling quality control technician in a white lab coat and hair net holding a clipboard while inspecting equipment in a food processing facility.

3.0 CURRENT SECTOR PROFILE

Establishment Profile

How big is the Canadian Dairy Processing Industry?

According to 2021 Statistics Canada business directory data, there were 392 dairy processing establishments across Canada that had at least one employee. This count includes sole proprietors with at least one employee and micro-businesses (less than 10 employees) which combined make up 34% of these businesses. Overall, the Canadian dairy processing industry consists mostly of small-medium enterprises (SMEs) with only 2% of processors in the larger size range at 500 or more employees. The industry employed 24,928 workers in 2021

Pie chart titled 'Dairy Processors by Size (# employees)' showing distribution: 10–19 employees (20%), 1–4 (17%), 5–9 (17%), 20–39 (17%), 100–199 (10%), 40–99 (9%), 200–499 (8%), and 500+ (2%).

The Canadian Dairy Processing Industry is largely composed of SMEs with fewer than 500 employees (98%).

What is the composition of the “average” Canadian Dairy Processor?

The “average” composition of a dairy processor shows that the most employees are entry level labourers (on average 40.9) , and not surprisingly also represent the highest number of current vacancies and new hires. The next most numerous occupation group (on average 16.2) is among management, finance, sales and administration. Smaller averages are found for skilled/semi-skilled process control and machine operators (5.7), other occupations (4.3) and quality control, assurance.

Chart showing average number of people employed, current vacancies, and hires in 2019 across five dairy sector job categories. Entry Level Labourers have the highest average employment (40.9), vacancies (2.6), and hires (16.3). Other categories include Skilled/Semi-Skilled Machine Operators, Management/Finance/Sales/Administration, Quality Control and Assurance, and Other Occupations with lower values.

The “average” composition of a dairy processor shows that the most employees are entry level labourers.

Woman in protective clothing, including a lab coat, hair net, and face mask, operating machinery with one hand while holding a tablet in the other inside a clean, modern food processing facility.

The Canadian dairy industry is heavily regulated. Regulations include food safety requirements as well as a complex supply management system that establishes production quotas, controls pricing, and sets import tariffs.

Where is the Canadian Dairy Processing Industry located?

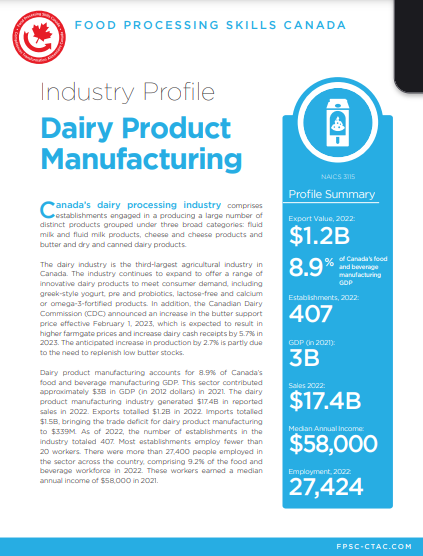
Dairy processing establishments are concentrated in Quebec and Ontario, accounting for 71% of the establishments and approximately 75% of the workers in 2021. Dairy processing plants are generally located close to where farm milk production is concentrated: producers of fluid milk tend to be located on the fringe of urban areas to serve the consumer market, while manufacturers of products with a longer shelf life tend to be concentrated closer to the raw milk supply to keep costs low and a reliable access to their main input. Milk processing facilities also tend to follow population concentrations. The Canadian dairy processing industry is primarily concentrated in Ontario and Quebec, and the two Western provinces (BC and AB). Ontario, the most populous province, has 162 dairy processing facilities and approximately 9,600 employees in 2018. In Quebec, there are 201 dairy processing facilities with 9,100 employees, the province with the largest number of dairy farms.

Map of Canada showing the number of federally and provincially licensed dairy processors by province and territory. Quebec has the highest total (201), followed by Ontario (162), and British Columbia (65). Totals include both federal and provincial licenses, with a national total of 514: 290 federal and 224 provincial.

Technology and Automation in the Dairy Processing Industry

Different technological advancements and innovations have been observed overtime as the dairy processing industry has evolved. The mechanization, automation and computerization of processes are observed primarily in large operations, while smaller producers may have slower rates of technology adoption due to costs and lack of economies of scale. Product innovation is at the heart of the industry, as it is a source of differentiation and increased competitiveness. For instance, membrane technology uses membrane filters of different structures at different pressures to separate milk components (e.g., whey proteins, lactose, minerals, bacteria and other organisms). This technology extends the product’s’ shelf life, standardizes its composition, minimizes waste while increasing yield and can be more energy efficient. Another example is a relatively newly developed procedure known as supercritical extraction that is able to remove cholesterol from milk fat, which leads to the development of low-cholesterol soft spread butter. Lab grown milk and dairy products, already being sold in the United States, may not currently be as attractive for Canadian consumers, but may gain popularity given their potential environmental benefits as the case for lab-grown proteins is built. Cheese, ice cream and frozen dessert technologies are also advancing, introducing new low fat or sugar free options, unique flavours, or increasing product homogeneity requiring less equipment to produce.

Bar chart titled 'To what degree has your business made investments in automation and digitization of production processes?' showing responses from a total sample and dairy sector. Most dairy respondents rated integration as 3 (38%) or 2 (35%), with fewer selecting 4 (14%), 1 (8%), and 0% for 5 (fully integrated). 5% responded 'Don't know'. The total sample follows a similar trend but with slightly higher responses for 4 (23%) and lower for 3 (29%).

On the survey of employers, approximately one-half (52%) of dairy processors reported moderate to higher levels of investments in automation and digitization of production processes. Compared to the overall food and beverage processing sector, the dairy processing reports overall moderate levels of investment with lower proportions of high investments, but 92% making some investment vs. 83% of the overall sector.

Production Facilities and Outsourcing of Production

On the survey of employers, it was highlighted that processors focus primarily on internal production in their own facilities (85%), with very few outsourcing their production (2%), while some blended both internal and outsourcing of production (12%). This would indicate that the labour requirements and challenges related to production are for the most part being experienced directly by the producers within their own facilities compared with some other manufacturing sectors that see considerably higher rates of outsourcing.

Pie chart showing how businesses handle production: 85% produce internally, 12% use both internal and outsourced production, and 2% outsource production only.

Source: FPSC Survey of Employers 2020 (n=89)
(DATA LINK – SLIDE #5 – PRISM Dairy Survey Deck – July 2020)

OCCUPATIONS PROFILE

Key Occupations

Occupations in the dairy processing are quite diverse, including equipment operators, laboratory technicians, food scientists, tanker and other truck drivers, engineers, programmers, accountants, sales and marketing professionals, and policy analysts.

Using the National Occupation Classification (NOC) system, five key occupations are identified for the dairy processing industry which are also common to various sub-industries in the food and beverage processing sector:

Other occupations that are relevant to the sector include:

NOC Code NOC code label Common Job Titles in Dairy Processing
9617 Labourers, food and beverage processing
  • Dairy helper
  • Production helper
  • Cheese factory worker
  • Dairy sampler
9461 Process control and machine operators, food and beverage processing
  • Cheese grader
  • Milk grader
  • Product tester
  • Dairy cream grader
  • Moisture content tester – dairy products
  • Milk dryer
  • Powdered milk dryer operator
9465 Testers and graders, food and beverage processing
  • Cheese blender
  • Cheese maker
  • Dairy plant machine operator
  • Dairy products specialty maker
9213 Supervisors, food and beverage processing
  • Dairy products processing foreman/woman
  • Dairy plant foreman/woman
  • Food testing supervisor
  • Ice cream processing assistant supervisor
  • Milk processing foreman/woman
1521 Shippers and receivers
  • Milk and cream receiver
  • Distribution clerk
  • Supply chain assistant
  • Stock handler
  • Delivery clerk

Levels of Diary Processing Occupations

Levels of Dairy Processing Occupations

There is room for a wide variety of skill levels and experience in the dairy processing industry. Skill levels range from foundational skill level dairy plant labourers who as entry level workers are not usually required to have specific experience or education, up to management and executive leadership roles that require specific experience and post-secondary requirements.

Career progression chart in dairy processing industry showing six levels: Foundational, Intermediate, High-Skilled, Supervisory, Management, and Senior Executive Leadership. Each level includes example job titles and associated experience or education requirements, ranging from no experience needed for Dairy Plant Labourers to 7–10 years of experience for Director of Operations/Production roles.

Career Pathways

A career ladder can be helpful to educate potential workers about the opportunities and career pathways within the dairy processing sector. The career ladder is a helpful tool for employers to attract, recruit and retain productive and skilled workers.

As the graphic illustrates, workers within High Skill Level occupations (such as Lead Hand) may move to the Quality Control/Quality Assurance Department and assume a role of Quality Control Inspector. This position is still a production/processing line position, but the Quality Control Inspector performs quality control tests and inspections on the processing line.

Vertical skill level chart for dairy processing careers, divided into two sections: Frontline Dairy Processing and Supervisory/Management. Levels include: Foundational (no experience), Intermediate (experience as plant labourer), High Skill (1+ year experience), Supervisory (3–5 years experience), Management (experience managing people and processes), and Executive Leadership (10+ years experience). Each level lists example job titles, such as Dairy Plant Labourer, Dairy Processing Lead Hand, Dairy Processing Supervisor, and Director of Operations.

WORKFORCE PROFILE

Workforce by Occupation

One of the largest occupation groups in the dairy processing industry is management, finance, sales and administrative occupations (37%). A slightly smaller sized occupation group is skilled and semi-skilled workers (31%). Other sizeable occupation groups include trades (13%) and entry-level labourers (10%).

Dairy Processing Employment by Occupation Group

Occupation Group # Employed
Management, Finance, Sales, Admin 9,190
Skilled/Semi-Skilled 7,615
Trades 3,757
Entry-level Labourers 2,457
Product Development and QC 1,391
Other 518
Total 24,928

Source: Statistics Canada, Census 2016

Management, finance, sales and administrative occupations (37%) are the largest occupation groups in the dairy processing industry.

Smiling woman in a white blouse sitting at a desk with a laptop, calculator, and charts, holding a printed financial report.

Workforce Age & Gender Distribution

Overall, the dairy processing workforce according to 2016 data are relatively spread out across the working traditional working age groups of 25 to 64 years of age. Approximately one half of the workforce (47%) is aged 45 years or older, with the other one half under the age of 45 (53%).

Across age groups, the majority of workers are male with two-thirds overall (66%) of the workforce. In the youngest age group of 15-24 year olds there is a proportionally larger group of females (40%) compared with the other age groups.

Examining recruitment and retention according to gender may be worthwhile for dairy processors to consider as they face increasing challenges of meeting their workforce needs within a ever-tightening labour market.

Dairy Processing Workforce by Age and Gender (2021)

Age Group % Group % Male % Female
15–24 13% 60% 40%
25–34 18% 67% 33%
35–44 22% 65% 35%
45–54 25% 68% 32%
55–64 20% 69% 31%
65+ 2% 75% 25%
OVERALL 100% 66% 34%

Source: Statistics Canada, Census 2016

Two smiling workers in a dairy processing facility wearing protective hairnets and uniforms, standing in front of industrial equipment.

Workforce Education Levels

The education credentials among the current workforce vary considerably within the industry and within occupation group. Entry-level labourers are the least likely to have post-secondary certificates or diplomas (30%), followed by those working in the skilled/semi-skilled occupation group (43%). Those in occupation groups such as product development and quality control have high rates of post-secondary certificates and diplomas (approximately 90%). Similar rates of post-secondary credentials are found among those working in management, finance, sales and administration (65%) and other occupations (63%).

Many positions within the dairy processing industry also require additional experience, certification and skills sets besides formal education credentials. For example, certain processor operations in the dairy sector require higher skills than other operating positions. In particular, occupations such as pasteurizer operators, CIP operators and raw milk receivers” require acute document use and numeracy skills; are required to communicate and collaborate with on-site inspectors; require enhanced thinking skills and perform more high-risk, critical operations in relation to HACCP and food safety.

Education Credentials by Occupation Type

Stacked bar chart showing education credentials by occupation type in the dairy sector. Entry-level Labourers and Skilled/Semi-Skilled roles have the highest proportions of workers with no certificate or diploma (61.53% and 57%). Product Development and Quality Control roles have the highest proportion with postgraduate degrees (10.13%) and undergraduate degrees (33.56%). Trades roles show a significant portion with apprenticeship credentials (21.86%).
Source: Statistics Canada, Prism Economics and Analysis 2021
(DATA LINK – SLIDE #15 – PRISM Dairy Outlook Deck – December 2021)

Workforce Diversity

When dairy processors were asked to describe their workforce, they reported on average 45% of paid positions were filled by women which is slightly higher than the overall sector average of 40%. Small proportions of paid positions were filled by recent immigrants (7%). Participation by Indigenous workers is relatively low in the industry at 1%. Persons with disabilites are noted as filling on average approximately 2% of paid positions.

On average, in 2019 how many paid positions were…?

Horizontal bar chart showing workforce characteristics in the dairy processing sector. 45% of positions are filled by women, 34% by workers under age 30, 18% by workers over age 55, 10% are unionized, 7% by recent immigrants, 2% by individuals with disabilities, and 1% by First Nations, Inuit, or Métis individuals.

Source: FPSC Survey of Employers 2020 (n=89)
(DATA LINK – SLIDE #7 – PRISM Dairy Survey Deck – July 2020))

Persons with disabilities are noted as filling on average approximately 2% of paid positions.

Part 2

UNDERSTANDING DEMAND


* HOW MANY WORKERS DOES THE SECTOR NEED?

Man in a plaid shirt operating a milking machine in a modern dairy facility, attaching equipment to cows in a milking stall.

4.0 OVERVIEW OF DEMAND DRIVERS FOR DAIR SECTOR

The demand drivers for the dairy processing sector are relatively complex and integrated with various factors. In attempting to understand and quantify demand estimates and projections, the study team examined numerous trends related to the key demand drivers outlined for the various industry components. The key areas of focus include:

The key areas of focus include:

Demand Drivers for the Dairy Processing Industry

Flowchart of the dairy supply chain starting with farm-based raw milk production, followed by dairy products processing and manufacturing into categories such as fluid milk, cheese, butter, yogurt, ice cream, and dairy-based food ingredients. These products move through domestic distribution—either to further processing, retail, or food service operations—or are exported, eventually reaching the consumer.

CONSUMPTION AND CONSUMER PREFERENCE TRENDS

Overall Consumption Trends

Overall, the consumption of milk dairy products is on a downward trend when viewed from a historical perspective; however, this is not the case when examining specific product areas (for example fluid milk vs. variety cheese consumption). Reasons for the changes and trends in dairy product consumption are complex and likely due to multiple factors. Some potential contributing factors include:

Dairy Product Trend
Fluid Milk
  • Steady decline in consumption
  • 98 litres per person (1980) → 63 litres per person (2019)
  • Estimated to decline further 13% to 55 litres per person (2030)
Cream
  • Dipped in 2020, but expected to recover and increase by 6% by 2030
Yogurt
  • Peaked at 11 litres per person (2015); coincides with dip in ice cream consumption
  • Has declined since 2015, but expected to be relatively constant at 9 litres per person (2030)
Ice Cream
  • Modest downward trend
Cheddar Cheese
  • 3.1 kilograms per person (2001) → 3.7 kilograms per person (2019)
  • Spiked to 4.1 kilograms per person (2018)
  • Expected to increase by 8% by 2030
Variety Cheeses
  • 6.8 kilograms per person (2013) → 8.5 kilograms per person (2019)
  • Expected to increase by 11% by 2030
Processed Cheese
  • 2.5 kilograms per person (2001) → 1.6 kilograms per person (2015)
Cottage Cheese
  • 0.9 kilograms per person (2001) → 0.6 kilograms per person (2019)
Line chart showing per capita dairy product consumption in Canada from 2001 to 2030, including actual data from 2001 to 2019 and forecast data from 2020 to 2030. Fluid milk consumption (right axis) shows a steady decline. Yogurt consumption rises until 2015 and then stabilizes. Cream and ice cream/milk products remain relatively stable with slight fluctuations. 'Other' dairy products show minor variation throughout the period.
Line chart showing per capita dairy product consumption in Canada from 2001 to 2030, with actual data up to 2019 and forecasts to 2030. Cheddar cheese and variety cheese consumption show an upward trend, especially variety cheese which is forecasted to exceed 9 kilograms per person. Processed cheese shows a steady decline. Cottage cheese and butter remain relatively stable with minimal change.

TRADE TRENDS

Historical and Current Situation

In 2020, Canada exported dairy products valued at $486 million while importing products valued at $957 million resulting in a negative trade balance of approximately $471 million.

Canada’s dairy exports have increased significantly. Since 2015, the value of Canadian dairy exports has increased approximately 130%, while during this period imports have risen 5% shrinking the trade balance.

Canada’s main dairy exports are:

In 2021, Canada’s imports of cream and not concentrated milk from the US have significantly increased from previous years. As well, imports of cheese from various countries have increased as well.

Exports by Product in 2020

Exports by Product in 2020
Source: Statistics Canada
(DATA LINK – SLIDE #16 – PRISM Dairy Outlook Deck – December 2021)

Canadian Dairy Trade Balance

Bar and line chart showing Canada’s dairy trade data from 2011 to 2020. Imports (blue bars) increased steadily from $669.9 million in 2011 to $957.2 million in 2020. Exports (gray bars) also rose from $252 million in 2011 to $486 million in 2020. The trade balance (blue line) remained negative throughout the period, reaching a low of -$734.4 million in 2016, then improving slightly to -$470.8 million in 2020.
Source: Statistics Canada, Prism Economics and Analysis 2021
(DATA LINK – SLIDE #15 – PRISM Dairy Outlook Deck – December 2021

Impacts of Trade Agreements

Three trade agreements signed in recent years (CETA ,CPTPP, USMCA) provide foreign producers with increased access to the Canadian market. The impacts of the current trade agreements on the Canadian dairy processing industry are expected to have differential impacts depending on the products and countries of origin. Some forecasted impacts include:

Trade Agreements

Canada will continue to import over 20,400 metric tonnes of cheese predominantly from EU origins under a tariff rate quota established by the World Trade Organization (WTO) in 1994.

Worker in a white coat and cap holding a clipboard, standing in a large warehouse filled with tall metal racks of round and rectangular wheels of cheese. The cheeses are stacked in rows and wrapped in yellow and beige coatings.

ECONOMIC INDICATORS

Canadian provincial economic environments are a key determinant of provincial dairy product consumption. Due in part to supply management of Canada’s dairy sector, most dairy products consumed in Canada are produced domestically. Consumption of dairy products can be affected by fluctuations in economic conditions, through substitution between high and low-cost products (especially in the case of cheeses), or food products purchased outside the home.

Economic growth is also closely tied to population growth, which has a significant impact on consumption of food and dairy products. While natural population growth rate is declining for Canada with an aging population and a falling birth rate, with established immigration targets, the population of Canada is expected to increase by 9% between 2021 and 2030 to reach 41.8million.

National Real GDP Growth Forecast:

Gross Domestic Product Growth (2017 to 2030)

Bar chart showing Canada’s real GDP growth from 2017 to 2030, with actual data from 2017 to 2020 and forecast from 2021 onward. Growth declined sharply to -5.4% in 2020, rebounded to 5.7% in 2021, and is projected to gradually stabilize around 1.6% to 2.4% annually from 2023 to 2030.
(DATA LINK – SLIDE #6 – PRISM Dairy Outlook Deck – December 2021) Gross Domestic Product Growth (2017 to 2030)

OUTPUT TRENDS

The projected value of output by product category was developed to factor in the various trends in economic and population growth, consumer consumption and preferences, and impacts from trade agreements.

Overall, following a decline in 2020, dairy sector output is estimated to rise 1.7% per year between 2021 and 2030.

Strongest annual average growth is expected in fluid milk and milk products of 2.5%, while growth in cheese and butter products is constrained to average around 1.2% due to the implementation of various trade agreements.

Out by Product, Canada (2010 to 2030)

Stacked area chart showing output by product in Canada from 2010 to 2030, with a forecast starting in 2021. The chart includes three product categories: processed fluid milk and milk products (blue), cheese and cheese products (gray), and butter, dry, and canned dairy products (yellow). Total output steadily increases over time, with a slight dip in 2020, followed by continued growth projected through 2030.
Source: Statistics Canada
(DATA LINK – SLIDE #16 – PRISM Dairy Outlook Deck – December 2021)

Dairy, Total Output

Stacked bar and line chart titled 'Dairy, Total Output' in Canada from 2010 to 2030, with forecast beginning in 2021. Bars represent three components: Consumption (blue), Intermediate Inputs (yellow), and Net Exports (red). A gray line indicates Total Output, which rises steadily over the period, with a slight dip around 2020 and continued growth projected through 2030.
Source: Statistics Canada
(DATA LINK – SLIDE #22 – PRISM Dairy Outlook Deck – December 2021)

5.0 SECTOR EMPLOYMENT OUTLOOK AND HIRING REQUIREMENTS

Employment Trends by Region Overall

Overall, dairy processing sector employment is projected to rise by 11% between 2021 and 2030. This would mean a rise from 24,928 jobs in 2021 to 27,585 in 2030, a difference of 2,657.

In terms of jobs to be created, the leading regions are those that are already have the largest dairy processing industries: Ontario and Quebec. Ontario is expected to add 1,120 jobs between 2021 and 2030 (up from 9,560), while Quebec is expected to add 786 jobs in the same period (up from 9,126).

In terms of relative employment growth in the dairy processing industry, Atlantic will be the fastest growing at 14% during this period, followed by Ontario with 12% growth. Quebec’s industry is expected to expand the most slowly with a predicted 9% growth between 2021 and 2030.

Dairy Processing Employment 2005-2030

Stacked area chart showing employment in the Canadian dairy sector by region from 2008 to 2030. The chart is divided by color into four regions: Atlantic (blue), Quebec (orange), Ontario (purple), and Western (dark purple). Ontario and Quebec account for the largest shares of employment, with overall employment rising steadily after a dip around 2020 and projected to continue increasing through 2030.

EMPLOYMENT GROWTH BY OCCUPATION TYPE

Overall Dairy Processing Employment Changes

The trend in employment growth between 2021 and 2030 remains relatively consistent across occupational groupings. Relative proportions do not fluctuate significantly, with management-finance-sales-administration- jobs remaining the largest share, followed by skilled and semi-skilled jobs.

Change in Dairy Processing Employment by Occupation Type, 2021 to 2030

Bar chart comparing employment levels in the Canadian dairy sector by occupation group between 2021 and 2030. Occupation groups include Management, Finance, Sales, and Administration; Skilled/Semi-Skilled; Trades; Entry-level Labourers; Product Development and Quality Control; and Other. Each group shows projected employment growth from 2021 (light blue bars) to 2030 (dark blue bars), with the largest increases in management and entry-level roles.
Source: Statistics Canada, Prism Economics and Analysis 2021
(DATA LINK – SLIDE #25 – PRISM Dairy Outlook Deck – December 2021)
Manage, Finance, Sales and Admin

The occupations in this group make up the largest proportion of jobs in the industry, and within this group, the sales jobs make up the largest proportion at 33%. Sales jobs are also expected to have the fastest growth rate within this group with 497 additional sales jobs created by 2030.

Entry-level Labourers

The labourer jobs are forecasted to have the largest growth with an increase of 26% or 645 jobs. It should be noted that this is largely the result of recovery and not due to longer-term growth trajectories for the occupation group. Many labourers were impacted by the COVID recession with total employment falling from 2,980 in 2019 to 2,255 in 2020.

Trades

Driver jobs are expected to grow from 1,077 jobs in 2021 to 1,152 in 2030, but the hiring challenges will be significant given the number of anticipated retirements in this field during this period.

Occupation 2021 2030 % Change Change
Management, Finance, Sales, and Administration 9,190 10,279 11.9% 1,089
 Management 2,005 2,269 13.2% 264
 Administrative 2,176 2,296 5.5% 120
 Sales 3,040 3,538 16.4% 497
 Logistics 1,547 1,748 13.0% 202
 Information Systems 423 428 1.4% 6
Entry-level Labourers 2,457 3,101 26.2% 645
 Labourers 2,457 3,101 26.2% 645
Other 518 583 12.6% 65
 All Other 518 583 12.6% 65
Product Development and Quality Control 1,391 1,529 10.0% 139
 Technical Occupations in Physical Sciences 1,031 1,095 6.2% 64
 Technical Occupations in Life Sciences 145 176 21.3% 31
 Other Technical Occupations 215 259 20.5% 44
Skilled/Semi-Skilled 7,615 7,931 4.2% 316
 Managers 1,340 1,501 12.0% 161
 Operators 6,275 6,430 2.5% 155
Trades 3,757 4,160 10.7% 403
 Drivers 1,077 1,152 6.9% 75
 Material Handlers 1,207 1,349 11.7% 142
 Other Trades 1,472 1,660 12.7% 187
Total 24,928 27,585 10.7% 2,657
Source: Statistics Canada, Prism Economics and Analysis 2021
(DATA LINK – SLIDE #35 – PRISM Dairy Outlook Deck – December 2021) 36

WORKFORCE HIRING REQUIREMENTS FOR THE DAIRY PROCESSING INDUSTRY

Over the 10 year period between 2008 and 2018, the dairy processing industry saw employment growth of approximately 8.5% or the addition of 1,900 employees. Between 2021 and 2030, the rate of employment growth is expected to be higher at approximately 11% growing from 25,000 employees in 2021 to 27,600 by 2030. This will require an additional 3,324 workers due to growth of the sector. However, the total demand for new employees during this time will be significantly larger due to the large number of replacement employees required for the sector as a result of retirements during this period (5,993 replacements needed). As a result, the dairy processing industry will need to find an additional 9,317 new employees by 2030. This total demand will be 36% due to growth, and 64% due to replacements.

Who will the dairy processing industry need to find?

On an annual basis, the industry will need to recruit:

Occupation Type Employment 2021 Employment 2030 Total Growth Annual Growth Replacement Demand Total Demand Average Replacement Demand Average Annual Demand
Management, Finance, Sales, and Administration 9190 10279 1089 11.9% 1634 2723 163 303
Information Systems 423 428 6 1.4% 96 102 11 11
Logistics 1547 1748 201 13.0% 435 636 48 71
Sales 3040 3538 497 16.4% 658 1155 73 128
Administrative 2176 2296 120 5.5% 708 828 79 92
Management 2005 2269 264 13.2% 689 953 77 106
Entry-level Labourers 2457 3101 645 26.2% 353 999 39 111
Other 518 583 65 12.6% 258 323 29 36
Product Development and Quality Control 1391 1529 139 10.0% 226 365 25 41
Skilled/Semi-Skilled 7615 7931 316 4.2% 2045 2361 227 262
Trades 3757 4160 403 10.7% 1036 1439 115 160
Total 24928 27585 2657 10.7% 5940 8597 660 955

Source: Statistics Canada, Prism Economics and Analysis 2021
(PRISM Dairy Outlook updated file sent January 2023)

Part 3

UNDERSTANDING WORKFORCE SUPPLY

A professional woman in a business suit is sitting at a conference table, holding a pen and thoughtfully looking ahead. In the background, two colleagues—one man and one woman—are engaged in a discussion, slightly out of focus. The setting appears to be a modern office or boardroom with documents and glasses of water on the table.

*Where will the workers come from?

6.0 Overview of Workforce Supply

CONSIDERATIONS IN IDENTIFYING SUPPLY SOURCES

Youth New Entrants

As the popultion of Canada ages, the overall proportion of labour supply that is made up of youth new entrants is expected to decline. Young people entering the Canadian workforce are expected to provide 68.1% of Ontario’s labour supply available to be hired by employers for new and replacement positions. A similar proportion (60.8%) is expected for Quebec, with much lower proportions anticipated for Atlantic (46.4%) and Western Canada (43.6%).

Dairy Processing Employment 2005-2030

Bar chart comparing youth labour supply for dairy processing across four Canadian regions (Atlantic, Quebec, Ontario, and Western) for the years 2010 and 2030. Quebec shows the highest youth new entrants in 2010, followed by Ontario, Western, and Atlantic. By 2030, all regions show a decrease in youth new entrants, with Quebec and Ontario still leading. Data source: Statistics Canada and Prism Economics and Analysis (2021).

Specifically for the dairy processing industry, the youth labour supply is expected to decrease in all regions between 2010 and 2030, with the largest drop occurring in Quebec going from approximately 500 in 2010, down to approximately 200 by 2030. Ontario is also expected to see a decrease in youth labour supply with a drop from approximately 350 in 2010, down to 225 by 2030. The dairy processing industry is likely going to have to continue to seek out and recruit from labour supply sources (e.g., immigration, other sectors) with less reliance on youth new entrants to meet labour demand.

Bar chart showing the average share of youth new entrants in the labour supply for the dairy industry across Canadian regions from 2022 to 2030. Ontario has the highest share at 68.1%, followed by Quebec at 60.8%, Atlantic at 46.4%, and Western at 43.6%. Data source: Statistics Canada and Prism Economics and Analysis, 2021.

Factors Impacting Labour Supply

In addition to understanding the fluctuating rate of youth new entrants on labour supply, there are other factors that can influence labour supply that can be characterized by sector. Some of these used to understand potential labour supply for the dairy processing include:

Unemployment Contraction: The potential labour supply can be impacted by contractions and expansions of unemployment rates. Contracting unemployment rates result in fewer job-seekers, and decreases in potential labour supply. Conversely, as unemployment rates increase, there are more job-seekers resulting in more individuals available to fill employment positions. Understanding unemployment fluctuation at the industry and regional level can inform important considerations regarding estimations of labour supply.

Labour Market Participation Adjustment: Similarly, labour market participation adjustments can impact labour supply. There are various reasons why individuals do not actively participate in the labour market such as raising a young family, caregiving for parents, attending school, retirement, or due to other personal contexts and situations. The labour market participation rate fluctuates according to various factors (e.g., population demographics, economic factors) and is an important consideration in understanding and predicting labour supply.

Other Sources of Supply: Another key consideration in understanding supply is identifying and quantifying potential o ther s ources o f w orkers. T hese c an f requently i nclude o verall immigration r ates, immigrant retention for specific regions, and potential employment fluctuations in similar sectors or occupations (e.g., other manufacturing sectors).

There are various reasons why individuals do not actively participate in the labour market such as raising a young family, caregiving for parents, attending school, retirement, or due to other personal contexts and situations.

Workforce Supply by Source for Other Food Processing Industry

The potential sources of labour supply for the dairy processing industry vary according to occupation groups between 2021 to 2030 to meet the projected overall demand for 9,316 workers. The largest source (65% or 6,012) is expected to be youth new entrants. Much smaller proportions will be derived from unemployment contraction (13% or 1,232) or other sources such as immigration (13% or 1,214). Labour market participation adjustment is expected to account for 9.2% of the labour market supply available to fill vacancies due to replacements or sector growth.

Occupation Type Youth New Entrants Unemployment Contraction Participation Adjustment Other Sources Total Supply
Management, Finance, Sales, and Administration 2,281 475 244 439 3,438
Management32561223352961
Administrative408103-66266712
Sales1,128215131-3281,147
Logistics34482-5134556
Information Systems7613-391464
Entry-level Labourers 816 127 592 -72 1,464
Labourers816127592-721,464
Other 127 29 12 35 203
All Other127291235203
Product Development and Quality Control 303 71 -86 22 310
Technical Occupations in Physical Sciences22551-884193
Technical Occupations in Life Sciences31571053
Other Technical Occupations4614-5863
Skilled/Semi-Skilled 1,593 305 -43 584 2,439
Managers24053-56161398
Operators1,354252124232,041
Trades 891 225 140 206 1,462
Drivers20980108367764
Material Handlers3559315128591
Other Trades3275217-289107
Total 6,012 1,232 859 1,214 9,316
Source: Statistics Canada, Prism Economics and Analysis 2021 (DATA LINK – SLIDE #37 – PRISM Dairy Outlook Deck – December 2021)

The annual changes in the components of the labour supply for the dairy processing industry fluctuate from year to year. In 2020, labour force declined in reaction to a drop in employment. Labour force participation fell, unemployment rose, and a smaller number of new entrants and workers from other sources found work in the dairy processing industry. Across all years, the largest component of supply is from youth new entrants

A stacked bar and line chart titled "Workforce Supply by Source for Dairy Processing, 2020 and 2030." The chart shows data from 2020 to 2030 with various sources of labour supply including Youth New Entrants, Unemployment Contraction, Participation Adjustment, and Other Sources. A magenta line represents the total supply over time. Each bar is color-coded by source and depicts year-to-year fluctuations in labour supply for the dairy processing industry in Canada. The source of the data is Statistics Canada and Prism Economics and Analysis (2021).

Part 4

PUTTING IT ALL TOGETHER – LABOUR MARKET TIGHTNESS

Close-up of a person analyzing business or financial data at a desk. The individual is holding a printed sheet featuring bar charts, pie charts, and line graphs, and is pointing at the sheet with a pen. Additional charts and a white calculator are visible on the desk, indicating a data review or reporting session in a bright, modern office setting.

7.0 Labour Market Tightness

LABOUR MARKET TIGHTNESS

Labour market tightness is a measure of the share of the annual supply change that occurs after accounting for available new entrants. Recruitment challenges increase as the proportion of workers need to be recruited from other industries, occupations and geographic regions rises. Recruitment challenges are exacerbated when tightness in other industries exceeds that of the dairy sector. The figure to the right shows the annual market tightness measure for the dairy manufacturing and all industries for Canada between 2012 and 2030.

The primary challenge in quantifying the supply of workers available to meet dairy processing industry demand is assessing the potential dairy processing labour force that would be recruited from other industries. This is especially difficult for production level workers with no specific tracked skills or qualifications to attach them to a specific sector other than experience. This makes it difficult to discern and measure any differences between worker availability and labour market conditions in one industry from another.

The method adopted in this analysis is to measure the annual hiring requirement for an occupation or trade, less the amount of new entrants available, as share of the labour force in the previous year. This assumes the recruitment challenges are greater in circumstances where relatively large numbers of workers are required in additional to the expected number of new entrants available. The analysis also considers the labour market tightness for the same occupation in all other industries. Recruitment challenges are expected to be greater when labour market tightness in other sectors exceeds that of those in the dairy sector.

Line and bar graph titled "Labour Market Tightness by Dairy and Overall, 2010 to 2030" comparing trends in the dairy manufacturing sector (orange bars) with all-industry trends (blue line). The graph shows fluctuating labour market tightness over time, with a noticeable dip in both sectors around 2020 followed by a rebound, and forecasts continuing through 2030. Data sourced from Statistics Canada and Prism Economics.

Prior to 2020 and the onset of the COVID-19 pandemic, the dairy processing industry had experienced ups and downs in labour market tightness, with higher levels leading up to the pandemic onset. This would be reflected in employers likely experiencing greater challenges in recruiting for various positions. Post 2020 until 2024, the outlook for the industry labour market tightness will be lower compared to all other industries. As of 2025 the level of labour market tightness will be smilar to the the levels predicted overall for industry.

Bar chart showing the average share of youth new entrants in the labour supply for the dairy industry across Canadian regions from 2022 to 2030. Ontario has the highest share at 68.1%, followed by Quebec at 60.8%, Atlantic at 46.4%, and Western at 43.6%. Data source: Statistics Canada and Prism Economics and Analysis, 2021.

LABOUR MARKET TIGHTNESS BY OCCUPATION

Labour market tightness is expected to persist through 2022 as economic recovery collides with reduced rates of labour force participation. This means that recruitment and retention will be particularly challenging for many occupations and roles through 2022.

Increased labour force participation is expected to ease recruitment challenges for several occupation groups by 2023, but then labour market tightness will return in 2028 onwards as labour force growth slows and there is increased competition from other industries.

By 2028, recruitment challenges will be most severe for occupations and roles related to:

Reading the Rankings

Labour markets have tightened significantly in recent years and what were previously periodic recruitment challenges have now become permanent challenges faced by employers in all sectors of the economy. Given this reality, the ranks are intended to be interpreted in relation to recruitment and retention conditions experienced over the previous five years. The analysis of labour market tightness uses a relative ranking system:

Color-coded scale showing recruitment/retention challenges: green (less challenging), yellow (comparable), red (more challenging) than previous years.

Recruitment and retention will be particularly challenging for many occupations and roles through 2022.

A color-coded table showing recruitment and retention challenges for various dairy industry occupation types from 2022 to 2030. Each cell is colored red, yellow, or green to represent increasing, consistent, or decreasing difficulty in recruitment/retention respectively. Occupation categories include Management, Administrative, Sales, Logistics, Entry-level Labourers, Skilled/Semi-Skilled, Product Development, Trades, and others.

Part 5

WORKING TOWARDS SOLUTIONS

Two dairy processing workers wearing white lab coats, hair nets, and gloves stand next to industrial equipment in a processing facility. One worker holds a clipboard and smiles at the camera, while the other stands beside a control panel.

8.0 Recruitment and Retention

CURRENT PRACTICES AND CHALLENGES

Business Challenges

The top business challenge for dairy processors in 2020 was identified as the availability of labour with over one-third (36%) identifying it as an “extreme challenge” and an additional one-quarter (25%) reporting labour availability as “somewhat” of a challenge.

This finding should be interpreted within the context of the labour market tightness projections which indicate that the challenges with recruitment and retention are expected to remain similar for the upcoming years for many occupations in the industry, with additional challenges and tightening occurring towards the end of the decade.

Bar chart titled “How would you rate the following in terms of their impact on your business…..?” showing responses from employers on five challenges: availability of labour, regulatory requirements, consumer trends, waste reduction/environmental requirements, and implementing new technologies. Responses are categorized by level of challenge: extreme, somewhat, a little bit, not at all, and don’t know. Availability of labour is rated the most extreme challenge (36%), while other categories have higher proportions in “somewhat” or “a little bit of a challenge.

HR Challenges

The three top human resource challenges identified by dairy processors are a lack of qualified applicants, lack of applicants with proper training or certification, and applicants having high expectations for wages and compensation. These challenges are similar to those identified within other food processing sectors, and various other Canadian industries. Labour market tightness and labour supply being outstripped by demand contributes directly to challenges such as lack of applicants and high expectations regarding compensation. The challenge related to applicants not having proper training could be traced to the availability of appropriate and accessible training programs for the industry, and possibly the level of career awareness and perceptions of the dairy processing industry among new entrants and other sources of labour.

Bar chart titled “FPSC Survey of Employers 2020” showing employer ratings on workforce challenges including: lack of qualified applicants, lack of applicants with training/certification, turnover/retention, absenteeism, high wage expectations, competition from employers, language/communication skills, sick leave abuse, and technology adaptation. Each bar is divided by percentage levels of perceived challenge: extreme, somewhat, a little bit, not a challenge, and don’t know. The highest “extreme challenge” ratings are seen for “Lack of applicants with training” and “Qualified applicants,” while most other challenges are rated “somewhat” or “a little bit” of a challenge.

Labour market tightness and labour supply being outstripped by demand contributes directly to challenges such as lack of applicants and high expectations regarding compensation.

Workforce Availability & Recruitment Challenges

Highlighted as the top business challenge among dairy processors, workforce availability challenges are characterized as immediate and persisitent by approximately one-third (36%) of processors, with an additional quarter (27%) indicating the challeng is ongoing.

Recruitment challenges for most had remained similar in 2020 compared to 2019 (58%), but one-third (35%) reported that they had increased either “moderately” or “significantly” over the year.

Bar chart titled “Would you say that recruitment challenges over the past year have...?” showing responses from employers: 58% said challenges “Stayed the Same,” 18% said they “Increased Significantly,” 17% “Increased Moderately,” 3% “Decreased Moderately,” and 2% “Decreased Significantly.”
Bar chart titled “How would you describe the general availability of workers you need?” showing responses: 36% reported immediate and persistent challenges in recruiting and retaining workers, 27% experienced ongoing challenges, 25% faced occasional or seasonal challenges, and 12% reported no significant challenges.

Other Food Jobs most Difficult to Recruit

Dairy processors reported that the jobs most difficult to recruit for were within the production department (66% reported challenges) with most frequent challenges occuring in recruiting skilled and semi-skilled process control and machine operators (26%), production workers (17%) and entry level general labourers (17%). These findings match with the labour market tightness outlooks, particularly with respect to general labourer recruitment.

Bar chart titled “How would you describe the general availability of workers you need?” showing responses: 36% reported immediate and persistent challenges in recruiting and retaining workers, 27% experienced ongoing challenges, 25% faced occasional or seasonal challenges, and 12% reported no significant challenges.

Dairy processors reported that the jobs most difficult to recruit for were within the production department.

A woman working in a dairy processing facility, wearing a hairnet and gloves, uses a blue colander to handle curds over several cheese molds at a stainless steel workstation.

Recruitment Efforts with Underrepresented Groups

Recruitment efforts among dairy processors indicated that particular efforts are being made to engage with and youth (58%), women (53%), workers over 50 years old (40%) and recent immigrants (36%).

Less frequently, dairy processors reported targeted efforts to engage with and potentially recruit among Indigenous groups (24%) or persons with disabilities (22%).

Given that these underrepresented groups are significant potential sources of labour within an increasingly tight labour market, dairy processors may need to consider further development and implementation of recruitment efforts that target and accommodate these groups in order to benefit more fully from from their participation in the industry.

Bar chart showing the percentage of employers making recruitment efforts from underrepresented groups. The groups and percentages are: Youth under 30 (60%), Women (53%), Workers over 50 (40%), New Canadians or immigrants (36%), First Nations, Inuit, Métis or other Indigenous persons (24%), and People with physical or mental disabilities (22%).

IMMIGRATION PROGRAMS:
OPPORTUNITIES AND CHALLENGES

Dairy processors reported very similar rates of usage of immigration programs when compared with the overall food and beverage processing sector with 16% reporting that they used federal immigration programs such as the Temporary Foreign Workers Program (TFWP), and 11% reporting using provincial immigration programs such as the Provincial Nominee Program (PNP). Dairy processors reported that on average 7% of their workforce is composed of recent permanent immigrants (arrived within the past 5 years) compared with 9% among the overall food and beverage processing sector.

Given the anticipated continued increase in immigration to Canada, there may be additional opportunities for the dairy processing sector to take part in accessing this growing labour supply depending on skill requirements, workplace culture developments, and support systems established.

Bar chart titled "Use of Immigration Programs" showing the percentage of employers using different immigration programs: Federal Immigration Programs (TFWP) – 16%, Provincial Immigration Programs (PNP) – 11%, and Other – 6%. Source: FPSC Survey of Employers 2020 (n=89).

EMPLOYEE PAY AND BENEFITS

Wages and Salaries

Wage and salary information for the dairy processing industry is contingent on region, sub-industry, occupation, skills and experience levels. The diversity in occupations and skill/education requirements should be considered in analysing wage and salary rates for the industry.

Dairy processors responding to the survey of employers in 2020 indicated an average hourly starting wage of $16.10 for an entry level front-line worker ranging from $13/hour to $28/hour. T his is in alignment with ESDC published 2020 hourly wages for labourers in food and beverage processing (NOC 9617) which ranged from $14.25/hour to $19.25/hour depending on province, with an overall median of $15/hour.

Using somewhat dated median income data from the 2016 Census, the overall median income for the dairy processing industry is approximately $48,500, with median income related to education and gender.

2015 Median Income – NAICS 3115

Level of education
(highest diploma)
Median Annual Income
Total Male Female
OVERALL $48,532 $53,369 $37,918
No certificate, diploma or degree $37,651 $44,037 $23,939
Secondary (high) school or equivalent $45,925 $49,939 $33,697
Apprenticeship or trades certificate or diploma $48,273 $54,724 $31,155
College, CEGEP or other non-university certificate or diploma $51,654 $59,445 $40,570
University certificate or diploma below bachelor level $57,872 $63,854 $52,906
University certificate, diploma or degree at bachelor level or above $62,733 $68,461 $55,991

Benefits

The dairy processors responding to the survey in 2020 noted a number of different benefits that they offered their employees. Almost all (97%) indicated that they offered an extended health of drug plan, while three-quarters (76%) reported providing paid days for sick or family leave. Slightly less than one-half (45%) reported RRSP matching or a pension plan. Approximately one-third (34%) provided tuition reimbursement for employees.

Bar chart displaying percentages of employers offering various employee benefits. The most common benefit is "Extended health or drug plan" (97%), followed by "Paid days or sick/family leave" (76%), "RRSP matching" (45%), "Pension plan" (45%), and "Tuition reimbursement" (34%). Less common benefits include "Bonus" (7%), and "Other," "Workplace perks," "Free products/discounts," and "Safety shoes/boot allowance"

Benefits offered by large dairy processors

From a review of job postings and employment boards, some of the benefits that were noted as being offered by large dairy processors included:

5 GENERATIONS IN THE WORKPLACE

FPSC conducted a study on career-related aspeications, expectations and preferences across five generations in the workplace. The key findings from this study can be applied to some of the potential solutions that the dairy processing industry is developing as it looks to address current and future challenges in with recruitment and retention in an increasingly tightening labour market

When developing solutions, keep in mind for everyone…

When developing solutions, keep in mind for younger workers, women, and new entrants to the labour market …

When developing solutions, keep in mind for Generation Z and Young Millenials…

PERCEPTIONS OF SECTOR

Recent studies by FPSC have highlighted the relatively low awarness of the food processing sector overall among Canadian. This contributes to the challenges processors are facing in recruitment and retention. A survey conducted in 2018 by FPSC found that only one in four Canadians reported being familiar with the food and beverage processing industry, and only one in six indicated that they would apply for a job in the industry if it was located near them.

Perceptions of the food processing sector tend to vary according to various factors which may be useful for dairy processors and the industry to consider as they attempt to develop and implement solutions to recruitment and retention challenges. Two groups that stood out in the analyses as being more attracted to employment opportunities in the sector are recent immigrants and Indigenous people. C urrently, the dairy processing industry employs slightly lower proportions of recent immigrants compared with the overall sector (7% vs. 9%) and is not a big user of immigration programming compared with some other food processing industries. Similarly, Indigenous people appear to be underrepresented in the dairy processing industry at 1% of the workforce on average across surveyed dairy processors.

A young woman wearing a white blazer sits in front of a laptop, looking slightly surprised or confused, with her chin resting on her hand.

Currently, the dairy processing industry of immigration programming compared with some other food processing industries.

EMPLOYER - LED TRAINING - OPPORTUNITIES AND CHALLENGES

Dairy processors report offering a wide variety of types of training to their employees with the most frequent being on-the-job training (92%), and in-house training (78%). On average, dairy processors reported allocating approximately $25,500 annually to training which results on average $330 per paid position.

One of the top HR challenges noted on the survey of employers for the dairy processing industry was a lack of applicants with the proper training and qualifications. While there are a limited number of dairy processing training programs in Canada, the requirements from employers appear to not being met with either the number and/or quality of graduates from these programs. Employer-led training is  another option that appears to be filling the gap for some employers.

Bar chart showing types of training used by employers. The most common are on-the-job training (92%), in-house team members providing training (78%), and online or computer-based training (62%). Other methods include manuals/quizzes (59%), group talks (57%), external consultants (54%), presentations (54%), seminars/webinars (38%), training from headquarters (30%), college/university courses (24%), with few using "Other" (5%) or "None of the above" (3%). Source: FPSC Survey of Employers 2020.

On average, dairy processors reported allocating approximately $25,500 annually to training.

9.0 Leveraging Canada’s Leadership In Education

EDUCATIONAL LANDSCAPE FOR THE SECTOR

The availability of training options for dairy processing, ice cream production, or cheese making in Canada is varied, with 33 courses or programs offered that specialize in these subjects as of 2020. Offerings consist of short courses or longer programs (generally no more than one-year). Continuing education courses may be taken individually or as part of a continuing education certificate program.

Training options are offered in three main subjects: cheese, dairy processing, and ice cream production. Making up over 70% of current training options, the focus on cheese instruction and cheese making is strong, including an introduction course on cheese, a course on cheese ageing, cheese-making workshops, and the professional fromager certificate. The emphasis on cheese is likely in response to the expected demand for cheese makers throughout the country and to increased interest in small batch artisanal cheese making.

Most training options are delivered through post-secondary education institutions. University programs, college certificate programs and continuing education require the participant be enrolled as a student. These programs would appeal to those interested in pursuing employment in the industry and who require technical skills to complete their job duties. Workshops and one-week training programs do not require enrollment as a student and may attract a wider range of participants: those working in the industry, those interested in the subject as a hobby or those involved in a small or medium-sized enterprise (SME).

Smiling woman holding a glass and bottle of milk in a dairy farm setting, with cows in the background inside a covered barn.

Canadian Dairy Commission's Workforce Development Initiative

The Workforce Development Initiative (WDI) was launched in 2018 as a three-year, $5 million funding program that promoted training in the dairy industry, provided scholarships to study in relevant areas (e.g., dairy science and dairy policy), as well as provided support for program development. The WDI provided funding for three programs pertinent to education and training:

Program Name: Details: Target Participant Group:
Scholarship Program To encourage graduate studies in the fields of animal science, dairy science and policy and economics as they relate to dairy. Graduate students
Career Promotion Program Promotes careers in the dairy industry Students and job seekers
Education Program Creates full-time, government-certified programs to train qualified staff to work in dairy plants. Students and job seekers
Continuing Education Program Provides training and upgraded learning opportunities to those already working in the dairy industry. Dairy industry workers

The Education Program creates full-time, government-certified programs to train qualified staff to work in dairy plants.

Two female workers wearing white lab coats, hairnets, and safety gear, smiling while standing in a dairy processing facility.

10.0 At the Crossroad – Moving Forward Recommendations

The Canadian Dairy Processing Industry like other food processing sectors is at somewhat of a crossroad with respect to attracting sufficient numbers of qualified, skilled workers in the upcoming decade to meet the anticipated hiring requirements due not only to projected industry growth, but also the proportion of current workforce who are at or near the age of retirement. The following recommendations and considerations have been developed based on the results of this labour market information study, combined with overall trends, opportunities and challenges that the Canadian food processing industry is addressing more broadly in the upcoming decade.

Positively Shift Industry Perceptions

Showcase the dairy processing industry’s current good business practices including environmental programs and corporate social responsibility.

Adapt Recruitment and Retention Strategies to the Workforce of the Future

Build and Grow Skills and Knowledge

CONTENTS

Report Resources

Subscribe to our Newsletter

Download or View Online